

Stocks fell again last week as some early September weakness played out, though not before a nice bounce on Friday to end the week. It was a news-heavy week across the board. Speaking of Friday, it was a somber day, as we mourned the nearly 3,000 people lost 25 years ago on 9/11. Never forget.
Some Early September Weakness Isn’t a Surprise
We aren’t surprised to see some early September weakness, as we have seen overall breadth deteriorate over the past few weeks. But we remain optimistic the weakness may be contained and is simply volatility ahead of the Federal Reserve’s decision on interest rates this Wednesday. We’ll focus more on that next week, but it’s looking like the Fed may hike rates for the first time in more than three years.
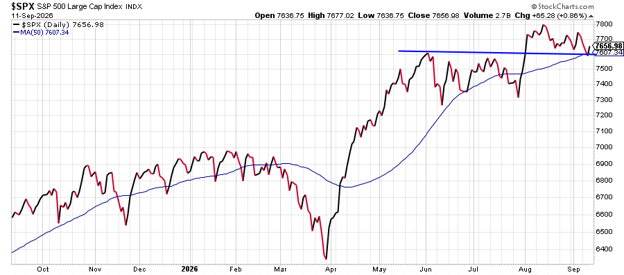
Turning to the S&P 500, we see strong potential support near current levels, as the upward-sloping 50-day moving average and the early June peak acted as support late last week. As you can see in the chart below, this area could continue to act as support, but if it gives way (not our base case, but always a possibility), more weakness would be normal.
The Message of the Market Remains Healthy
Why do we remain optimistic, even when oil is soaring, rates are soaring, and consumer confidence tanks? The market message remains healthy. Areas like REITs, utilities, and staples have all been relatively weak the past few weeks, which isn’t what you would expect if things were about to turn much worse. Historically, these defensive areas would find a bid (meaning strength or buying) relative to the broader market or other indexes, and this isn’t happening.
The Inflation Data May Force the Fed to Act
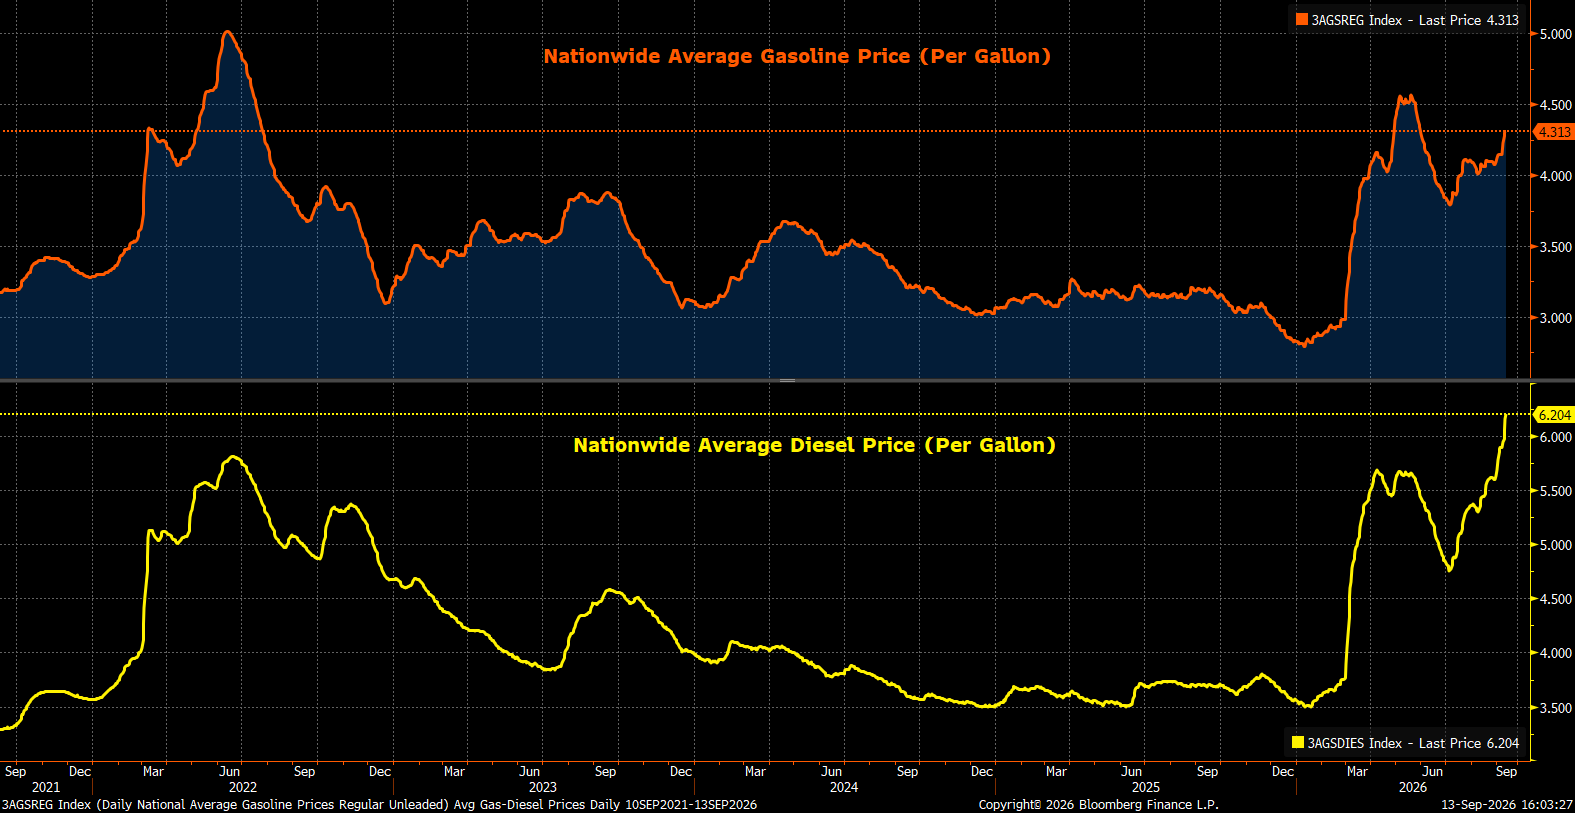
Oil prices have surged over the last few weeks, taking nationwide average gasoline prices to $4.31/gallon, the highest ever for this time of year. Diesel has hit a record $6.20/gallon. That matters because diesel is what moves food and other goods across the country, allowing higher oil prices to seep into a broad array of goods and services. With the situation in the Middle East heating up, the inflation outlook has deteriorated quickly.
Source: Carson Investment Research, Bloomberg 9/13/26
The bad news is that the recent surge in oil prices and its derivatives is not reflected in the August inflation reports we got last week. Those reports were not a huge surprise, but it’s worrying that elevated inflation readings no longer surprise us. And worse data is likely coming.
Gasoline and diesel prices were already creeping higher in early August, boosting the headline consumer price index (CPI) to a 0.4% m/m gain (equivalent to a 4.9% annualized pace). That offset the prior two months of soft readings, but CPI is up 3.4% over the last twelve months. Core CPI, which excludes volatile food and energy prices, didn’t offer much comfort, rising at a 3.5% annualized pace in August, though the core index is up just 2.4% over the past year.
You could look at the core CPI rate of 2.4% year-over-year inflation and conclude that inflation data doesn’t look too bad. The problem is that it’s skewed by soft rental inflation, which makes up 42% of the core basket. The broader personal consumption expenditures (PCE) index, the Fed’s preferred measure, puts much less weight on shelter, about 17% of core PCE. August PCE data won’t arrive until the end of the month, but CPI and producer price index (PPI) data give us a good read. One caveat is that the government is changing how it calculates inflation for several items, including portfolio management services, legal fees, and computer software and accessories. Taking that into account, estimates suggest:
- Core PCE is expected to rise 0.28% m/m in August (equivalent to a 3.4% annualized pace).
- That would bring core PCE to 3.1% year over year.
Those are aggregate numbers. Under the hood, inflation is elevated across the board, well beyond anything tied to energy.
Services Inflation Is Running Hot, Too
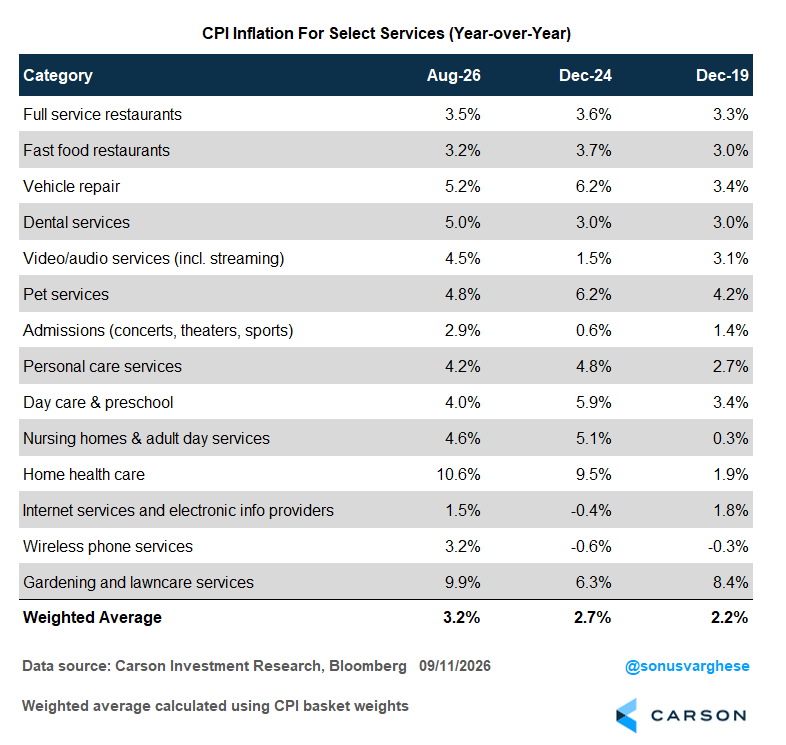
Take services inflation. Core services CPI excluding shelter rose at a 6.3% annualized pace in August and is up 3.1% over the past year. August was boosted by an idiosyncratic jump in wireless phone services, which is tempting to dismiss. The problem is that several other services that households regularly use are also running hot.
The table below shows year-over-year inflation for 14 of these categories versus the end of 2024 and 2019. Their weighted average is running at 3.2%, compared with 2.7% at the end of 2024 and 2.2% at the end of 2019. In other words, these prices are not just above pre-pandemic levels—they’ve accelerated over the past 18 months even as aggregate core CPI looks benign. And they matter: together these categories make up almost 17% of the overall CPI basket, or about 21% of core CPI.
Industrial Prices Are Heating Up as Well
Industrial prices are heating up as well. The August PPI report showed elevated inflation across a wide range of key intermediate goods used in manufacturing:
- Electronic computers and equipment: +23% y/y (3-month annualized 75%).
- Electronic components: +28% y/y (3-month annualized 13%).
- Electrical machinery equipment: +14% y/y (3-month annualized 9%).
- Steel mill products: +23% y/y (3-month annualized 41%).
- Wire and cable: +20% y/y (3-month annualized 20%).
- Plastic packaging products: +6% y/y (3-month annualized 12%).
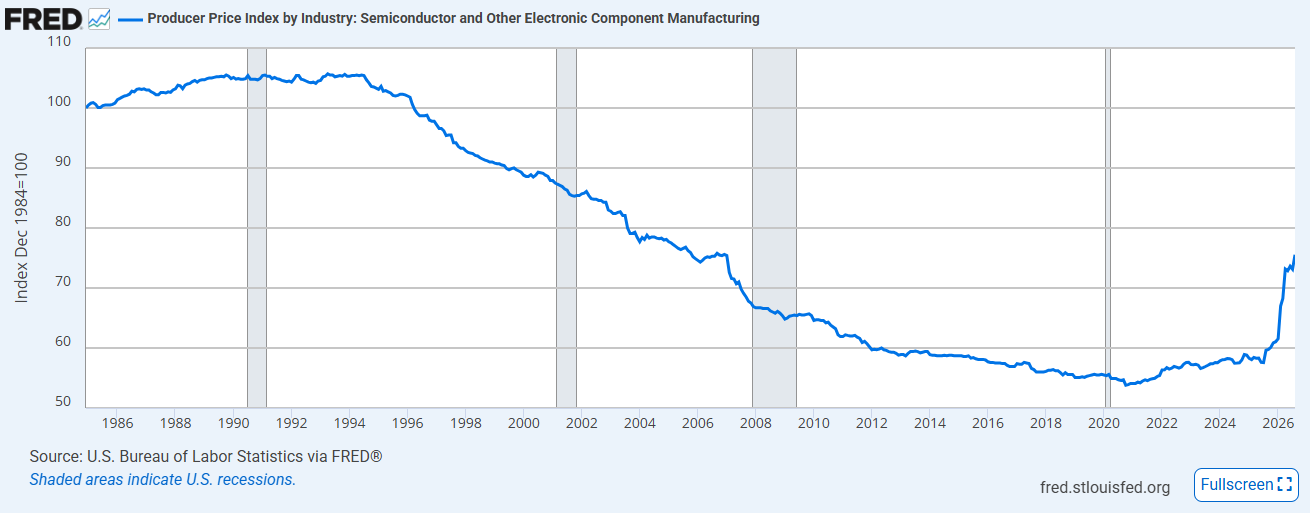
A lot of this reflects tariffs, including on steel and aluminum, and the AI buildout. Two AI-related bottlenecks stand out. PPI for semiconductor and other electronic component manufacturing has risen at a 15% annualized pace over the last three months and is up 27% from a year ago. As the chart below shows, that surge has wiped out more than 20 years of deflation.
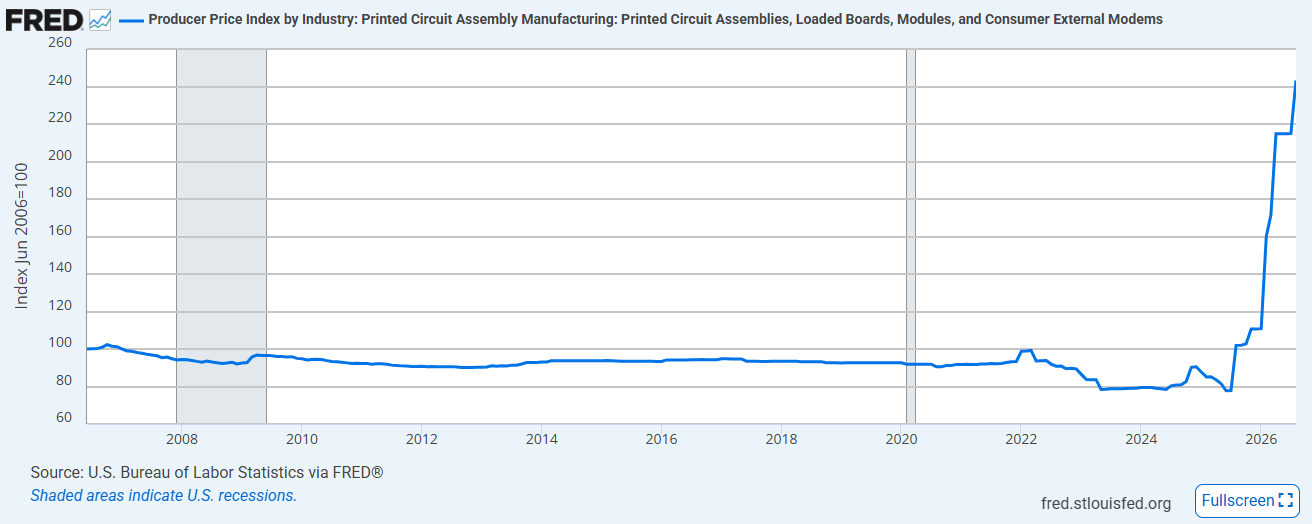
Manufactured printed circuit boards are even more extreme: prices rose at a 65% annualized pace over the last three months and are up 139% from a year ago. As the chart below shows, the recent increase is unprecedented.
There’s another side to this data: revenue and profits for semiconductor chip makers. One person’s inflation is another company’s profit source, and the AI boom neatly captures that. Demand for AI-related inputs is far outrunning supply, which is why prices are surging alongside profit growth. That profit growth, in turn, has been a major driver of the stock market near-record highs.
The Fed May Be Poised to Start a New Rate Hike Cycle
The most common argument against Fed rate hikes is that higher interest rates cannot increase oil supply or reopen the Strait of Hormuz. That is certainly true, but the breadth of the inflation problem makes it increasingly untenable for the Fed to sit on the sidelines. The economy is running hot: unemployment is historically low at 4.1%, manufacturing and services activity are strong, businesses continue to report rising input costs, and nominal GDP growth is running above 6% (even if inflation explains a meaningful portion of that).
That is a change from where we stood even a couple of weeks ago, when our base case was that the Fed stays on hold the rest of this year. The data has moved quickly and so has our view.
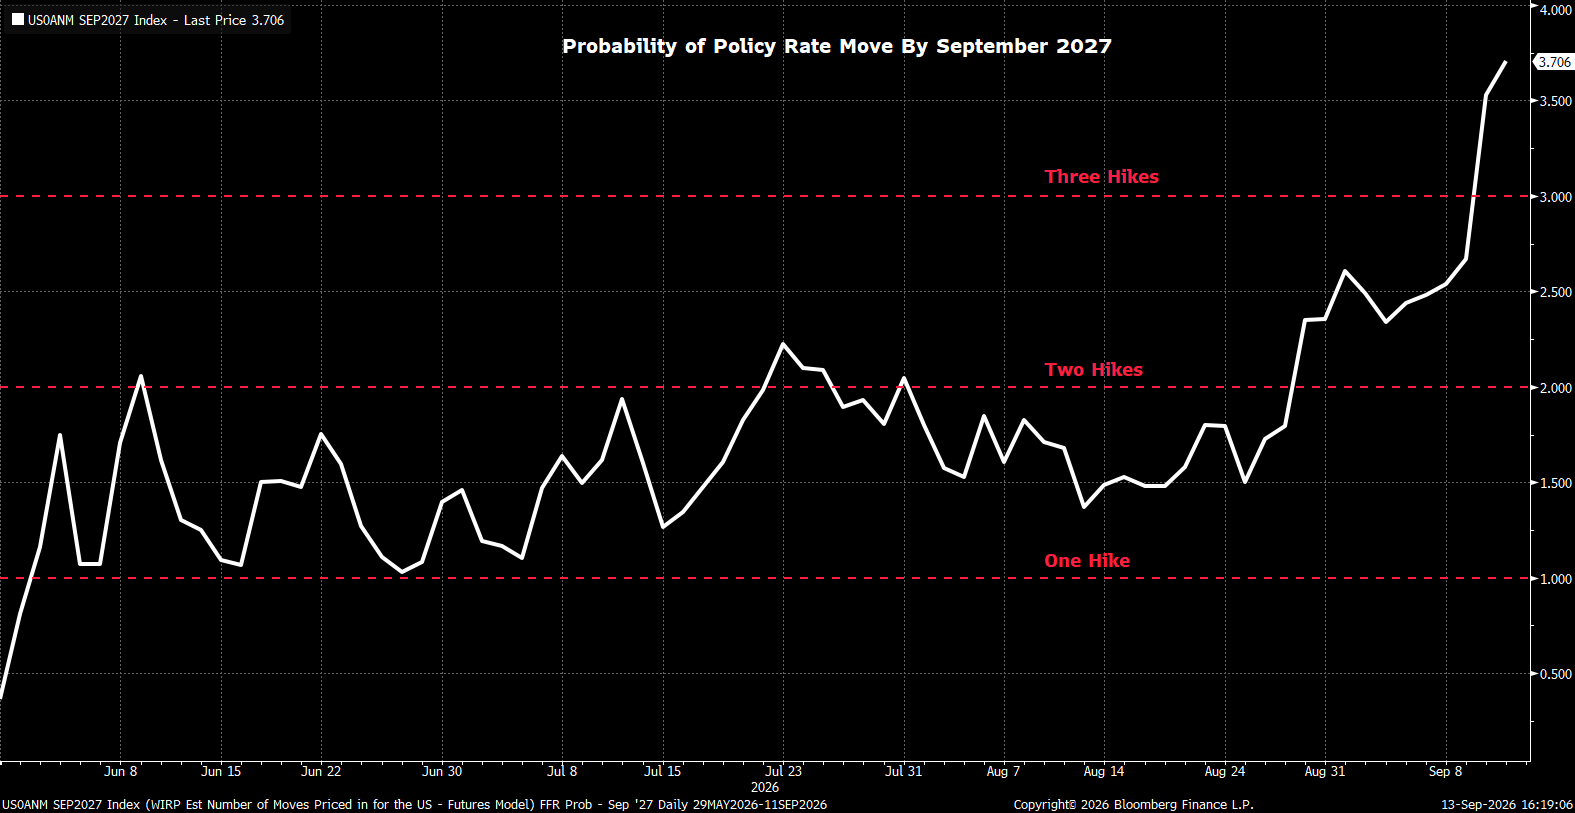
That’s why markets are pricing an 86% probability of a rate hike at this week’s Fed meeting. And historically, the Fed has rarely hiked just once. The question could quickly shift from “Will they hike?” to “How many more hikes are coming, and how quickly?” Markets are currently pricing roughly 3.7 hikes over the next year, or three hikes plus a 70% chance of a fourth.
Source: Carson Investment Research, Bloomberg 9/13/26
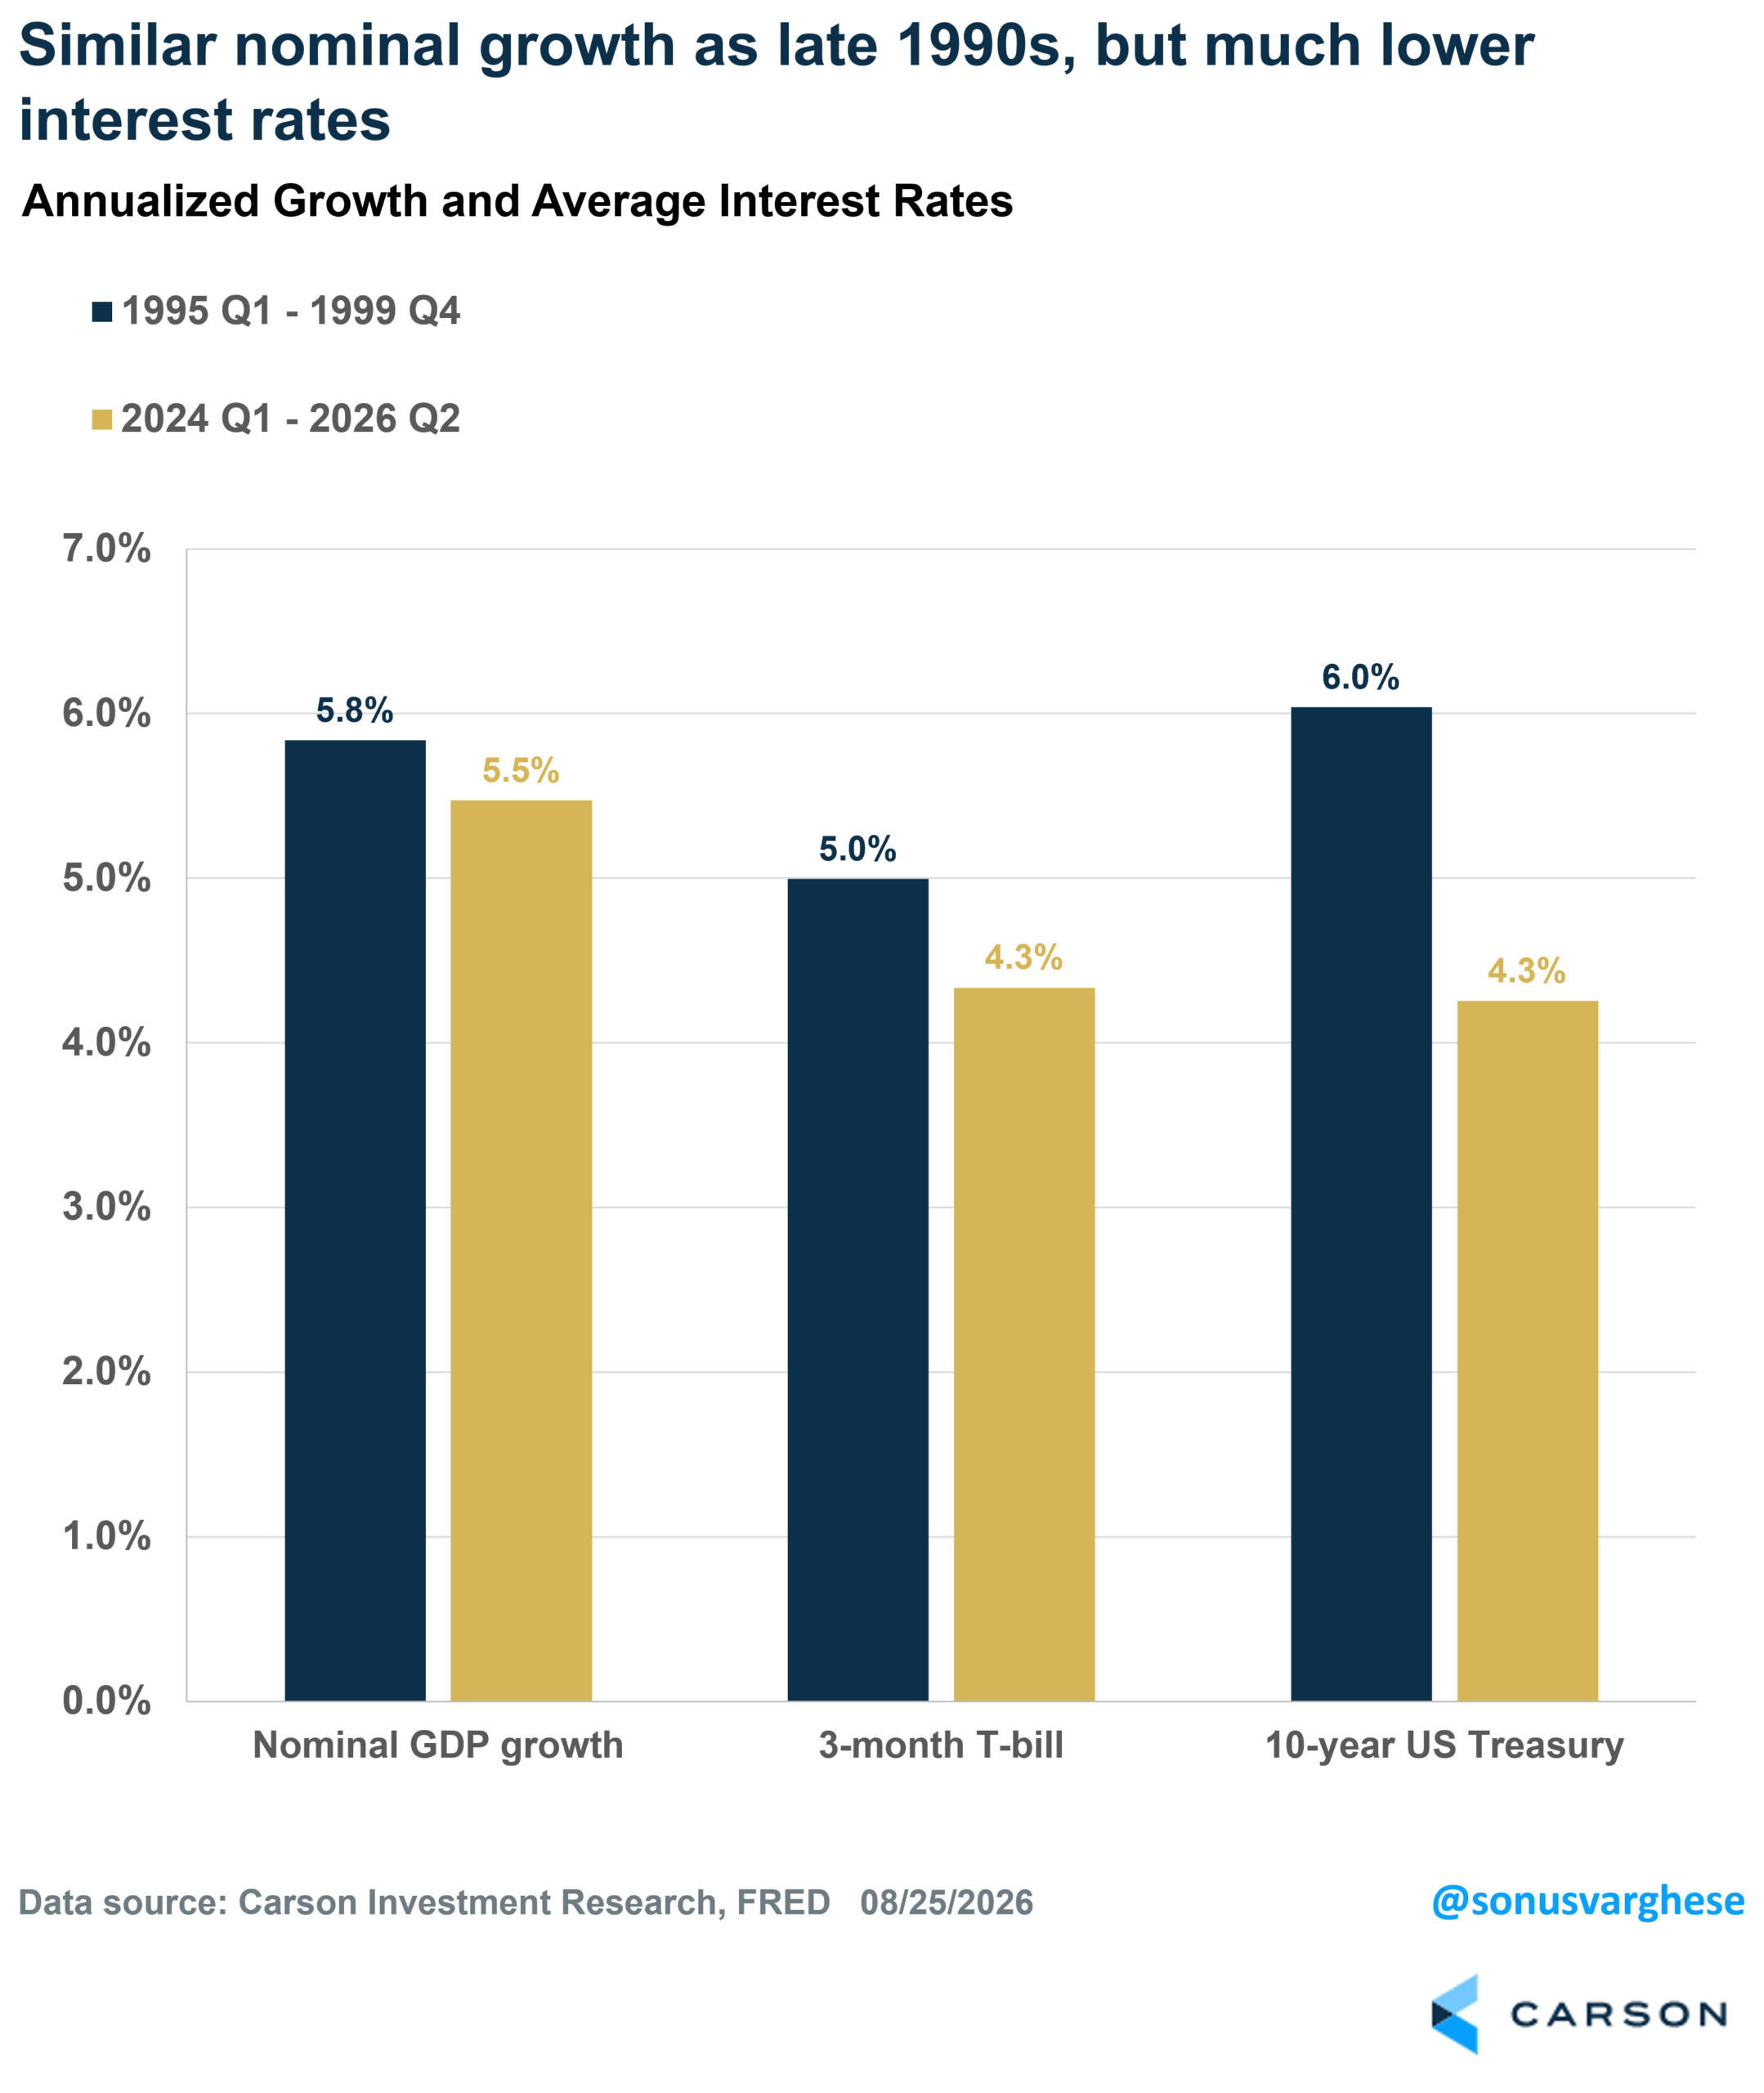
That expected degree of tightening would take the policy rate from 3.6% to about 4.5% over the next year. That sounds significant, but given how hot the economy is running in nominal terms, it may not slow things much, especially the AI buildout. As we’ve written before, nominal GDP growth is close to what we saw in the late 1990s, a period when both short- and long-term interest rates were higher than they are today.
The risk to this view runs in both directions. If a hiking cycle isn’t enough to cool an economy running this hot in nominal terms, then the inflation problem doesn’t get solved either, and the Fed may eventually have to tighten more than markets currently expect—and leave policy tight for longer. That would likely mean more volatility, even with a strong earnings backdrop.
For now, though, we believe the economy is poised to keep running hot even if the Fed kickstarts a new hiking cycle this week. That should keep corporate revenues and profits growing at a strong pace, which remains a tailwind for stocks.
S&P 500 — A capitalization-weighted index of 500 stocks designed to measure performance of the broad domestic economy through changes in the aggregate market value of 500 stocks representing all major industries.
The NASDAQ 100 Index is a stock index of the 100 largest companies by market capitalization traded on NASDAQ Stock Market. The NASDAQ 100 Index includes publicly traded companies from most sectors in the global economy, the major exception being financial services.
The views stated in this letter are not necessarily the opinion of Cetera Wealth Services LLC and should not be construed directly or indirectly as an offer to buy or sell any securities mentioned herein. Investors cannot invest directly in indexes. The performance of any index is not indicative of the performance of any investment and does not take into account the effects of inflation and the fees and expenses associated with investing.
A diversified portfolio does not assure a profit or protect against loss in a declining market.
All investing involves risk, including the possible loss of principal. There is no assurance that any investment strategy will be successful. This information is from sources believed to be reliable, but Cetera Wealth Services, LLC cannot guarantee or represent that it is accurate or complete.
9124347.1-0926-C
